Like it?
Star it!
'Receipt_Analyzer_3.0' is a Python-based application that I made from July to September 2022 that utilizes a scratch-built GUI, a SQL database, and 4,768 lines of Python code in order to collect and then analyze an individual's finances, handling said data with Regex filtering Absolutely no AI was used to make this
Software: Python, PostgreSQL, and Bash
Libraries: Numpy, Pandas, os, Matplotlib, Seaborn, Datetime, Regex, Psycopg2, TKinter, and Custom TKinter
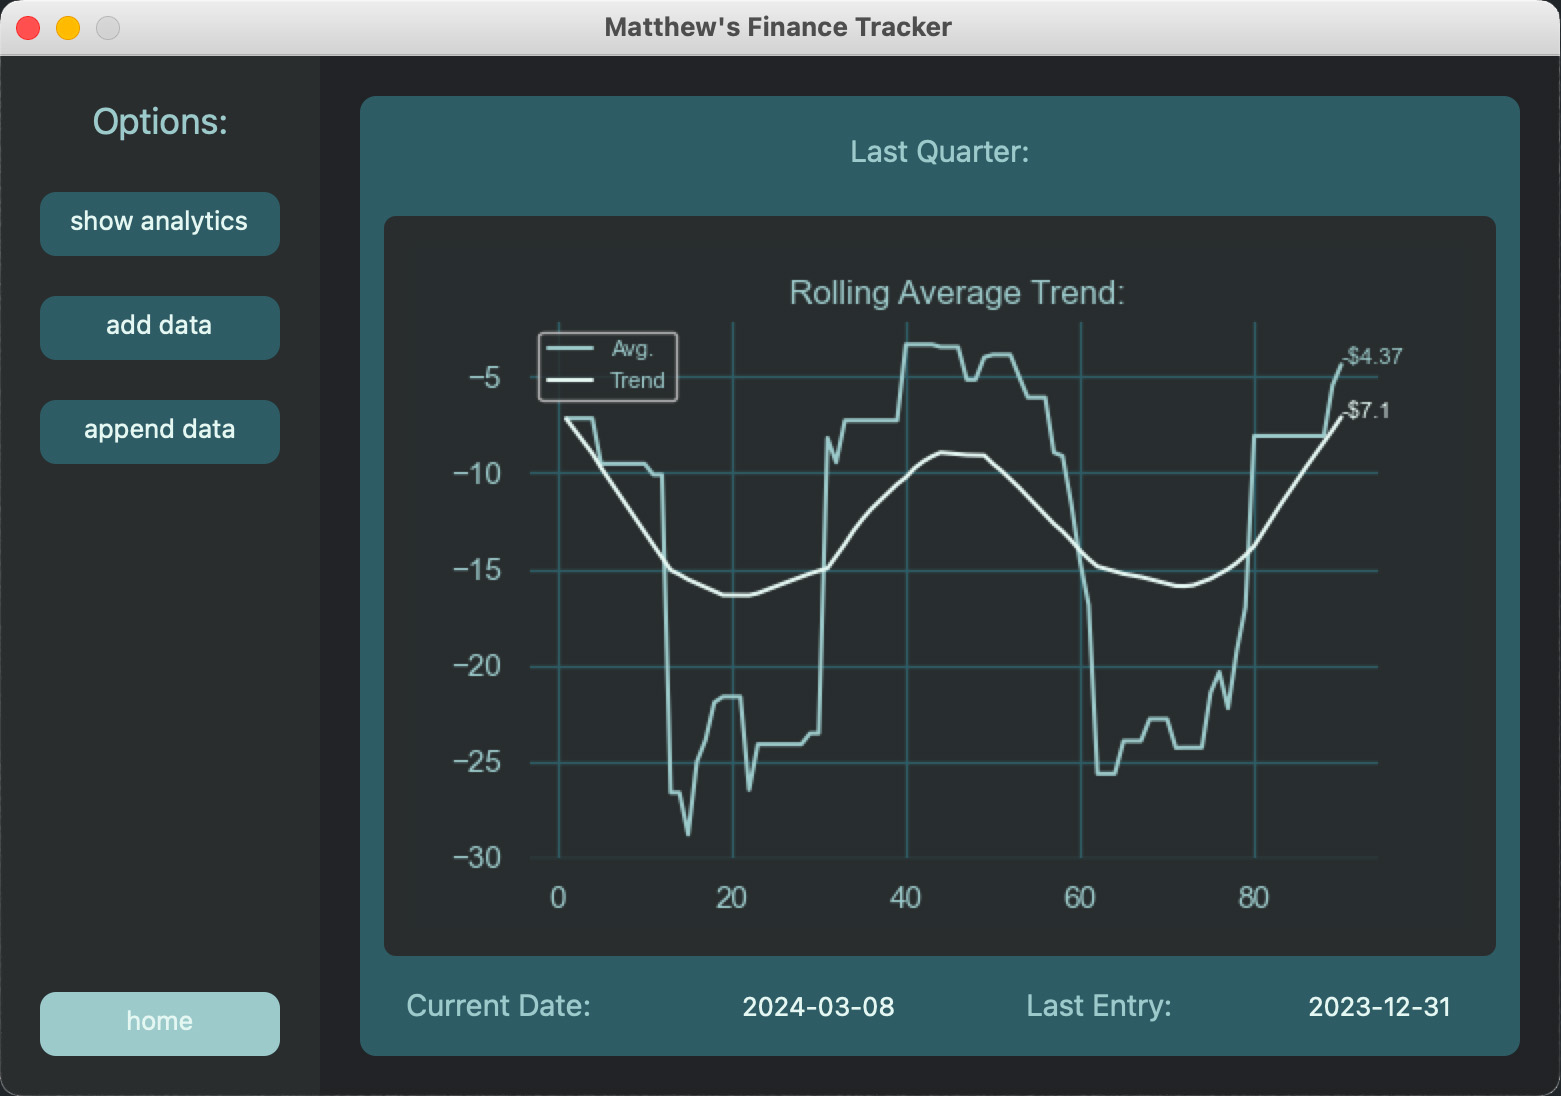
When opening the app, the user is greeted with the home page, in which a rolling average chart not dissimilar to one seen on the stock market is seen displaying the previous 3 months' worth of entries, as well as a line of best fit that provides a more accurate representation of the data
On the bottom of the home page view, the current date as well as the date of the latest entry are both displayed, and to the side, a navigation bar that allows the user to select which action they would like to take
The 'home' button, like all buttons on this app, will change color when hovered over, and when clicked, will take the user back to the home page from anywhere in the app
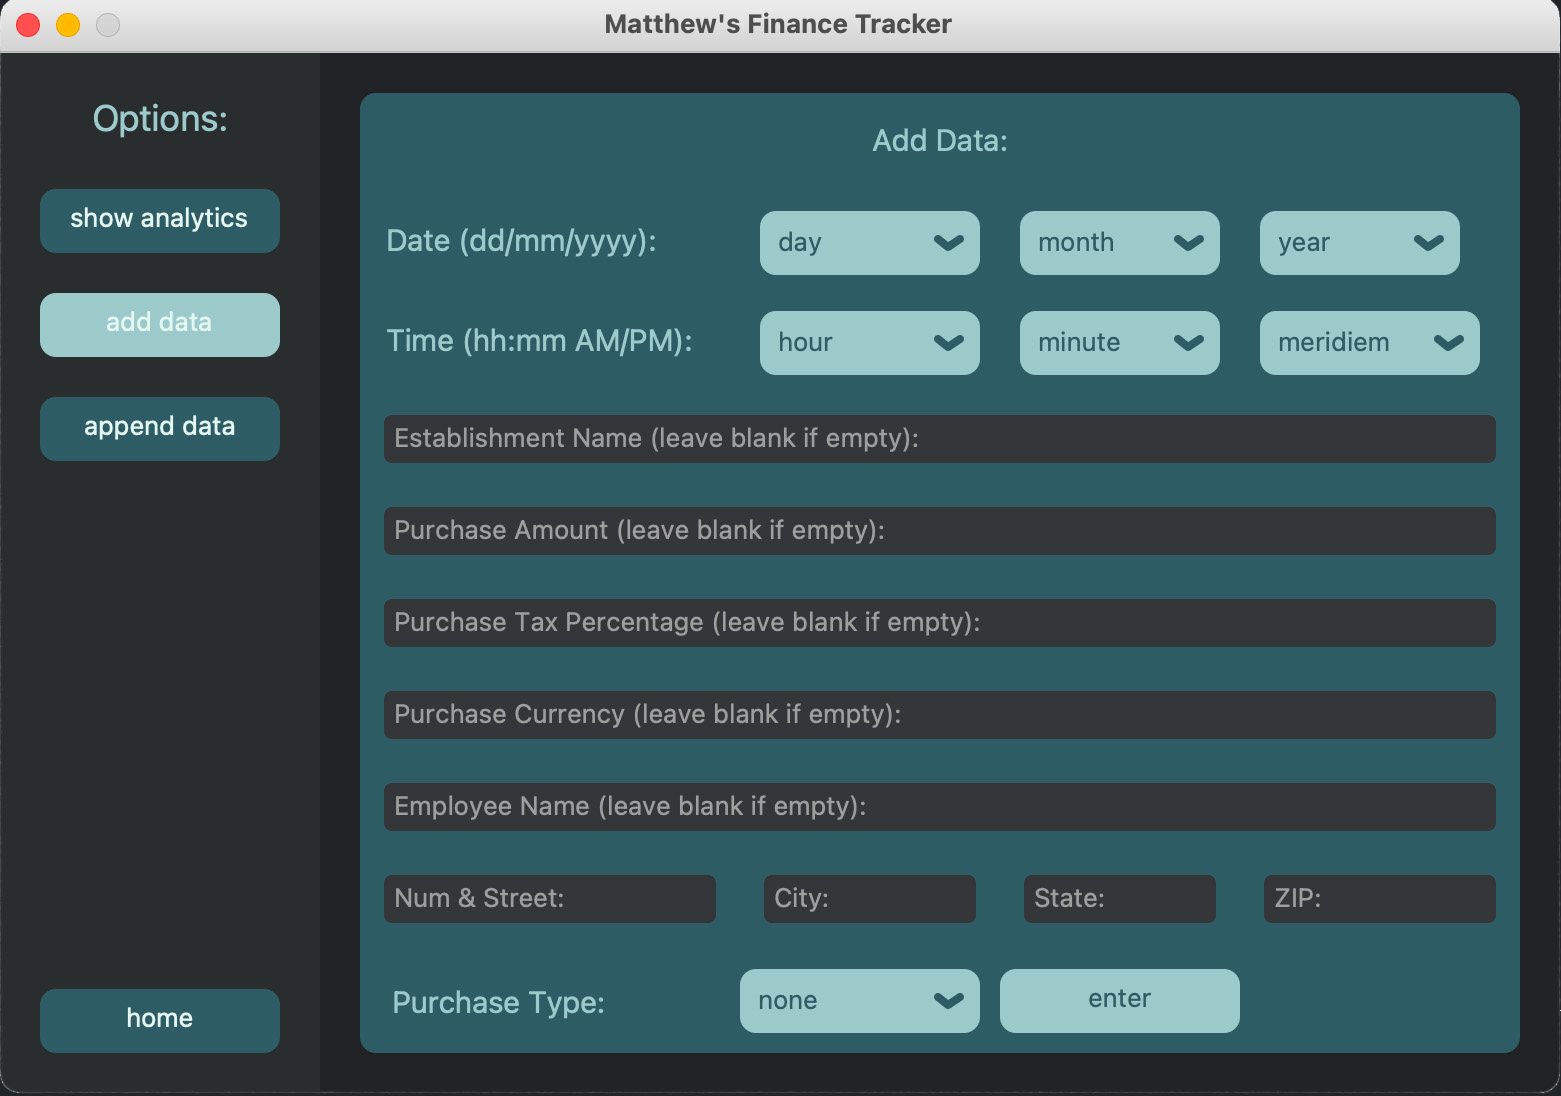
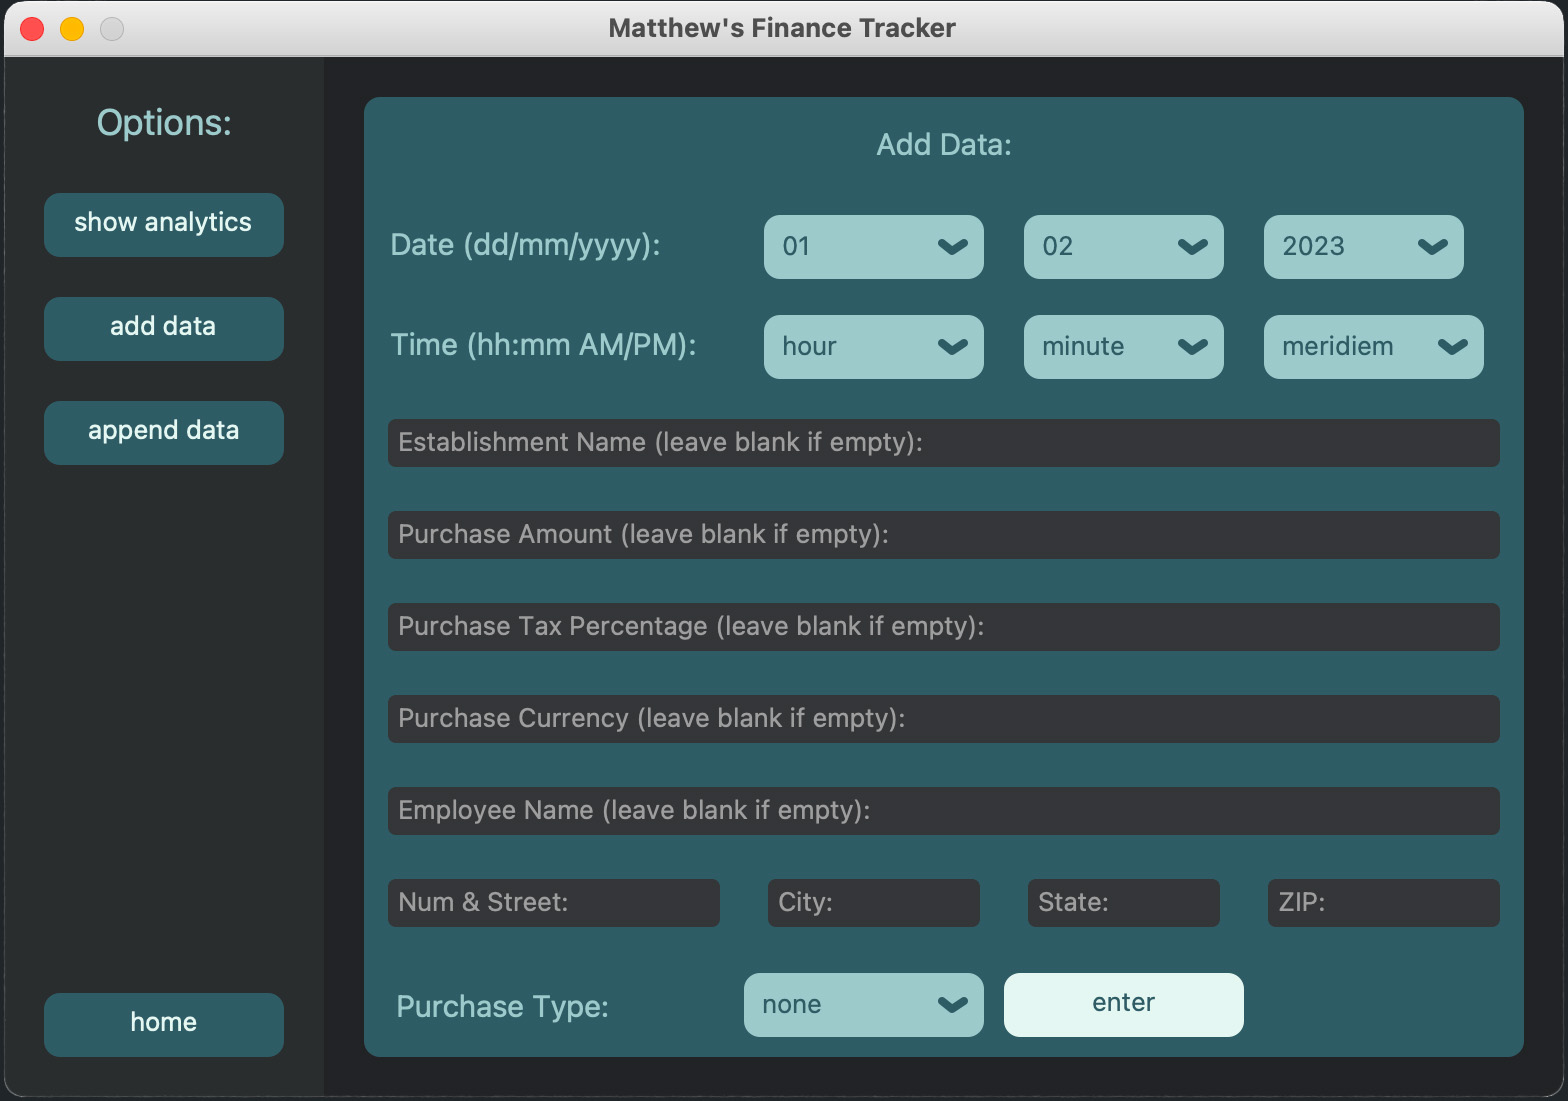
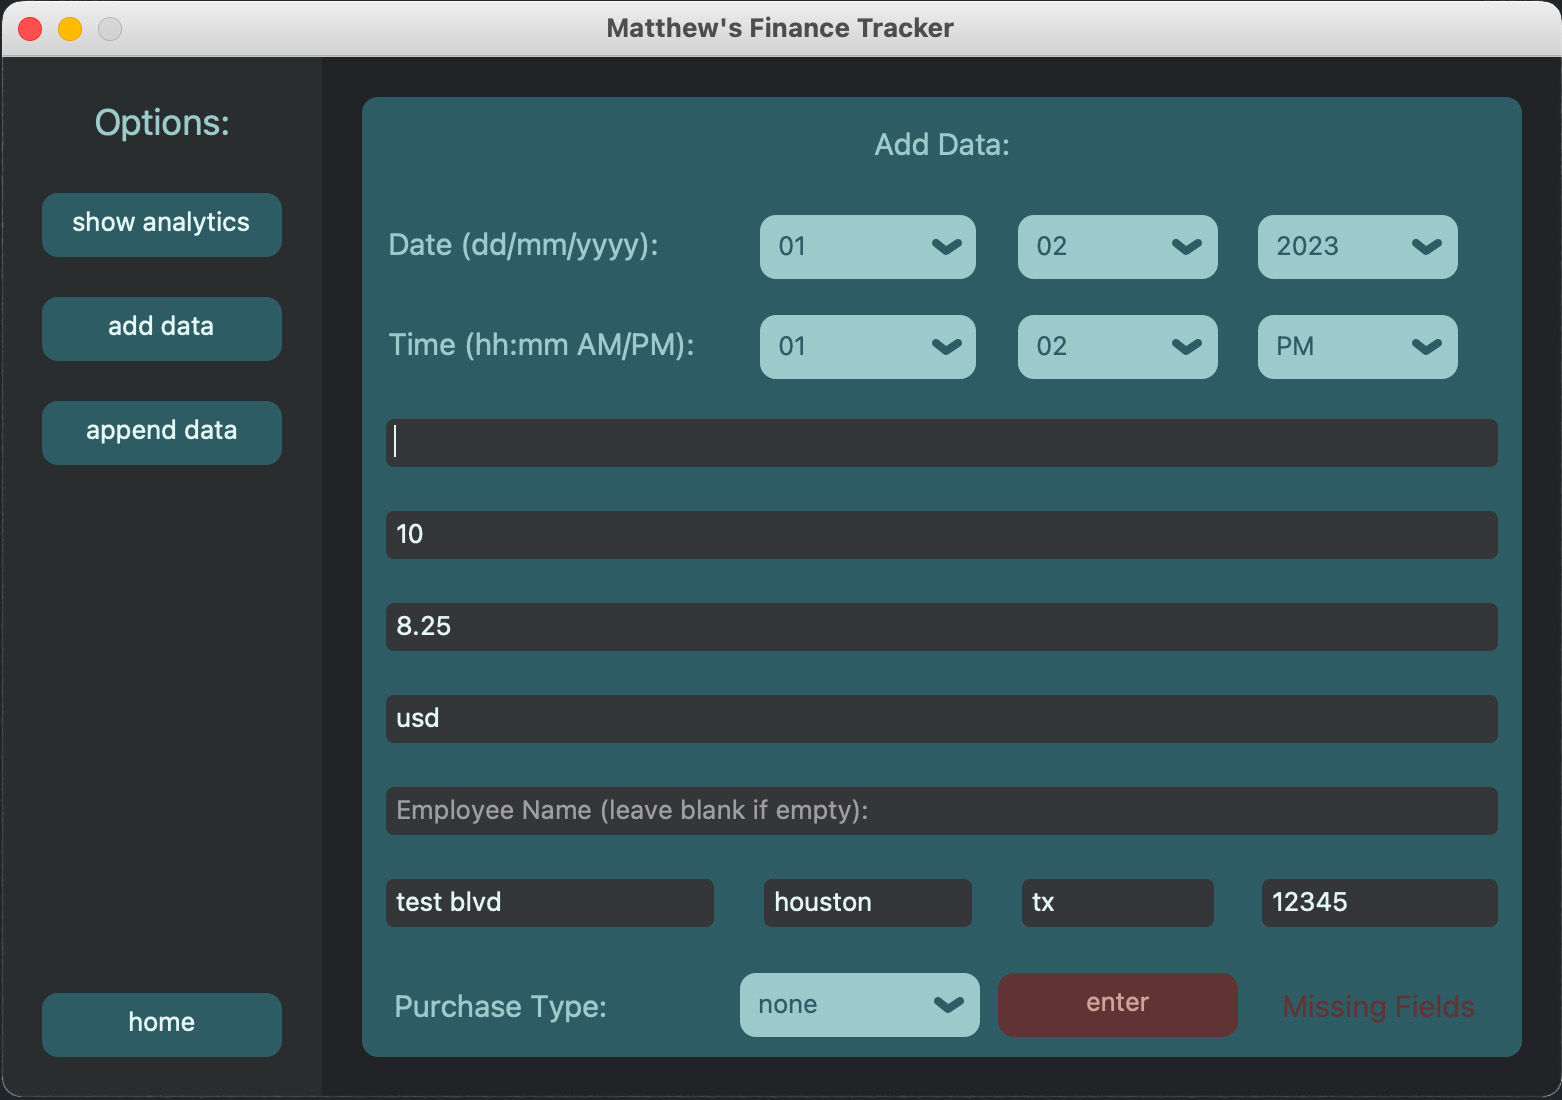
As the user presses the 'add data' button, they are taken to a new view in which they can enter the data from their receipt. The user is prompted to enter the date, the store, the total, and any other relevant fields, such as the type of purchase made
When entering data, some items are required to fill out, and others are optional. For example, fields such as the date are always mandatory, some fields are mandatory only if the user has a receipt, such as the purchase amount, and some fields are always optional, such as the employee name
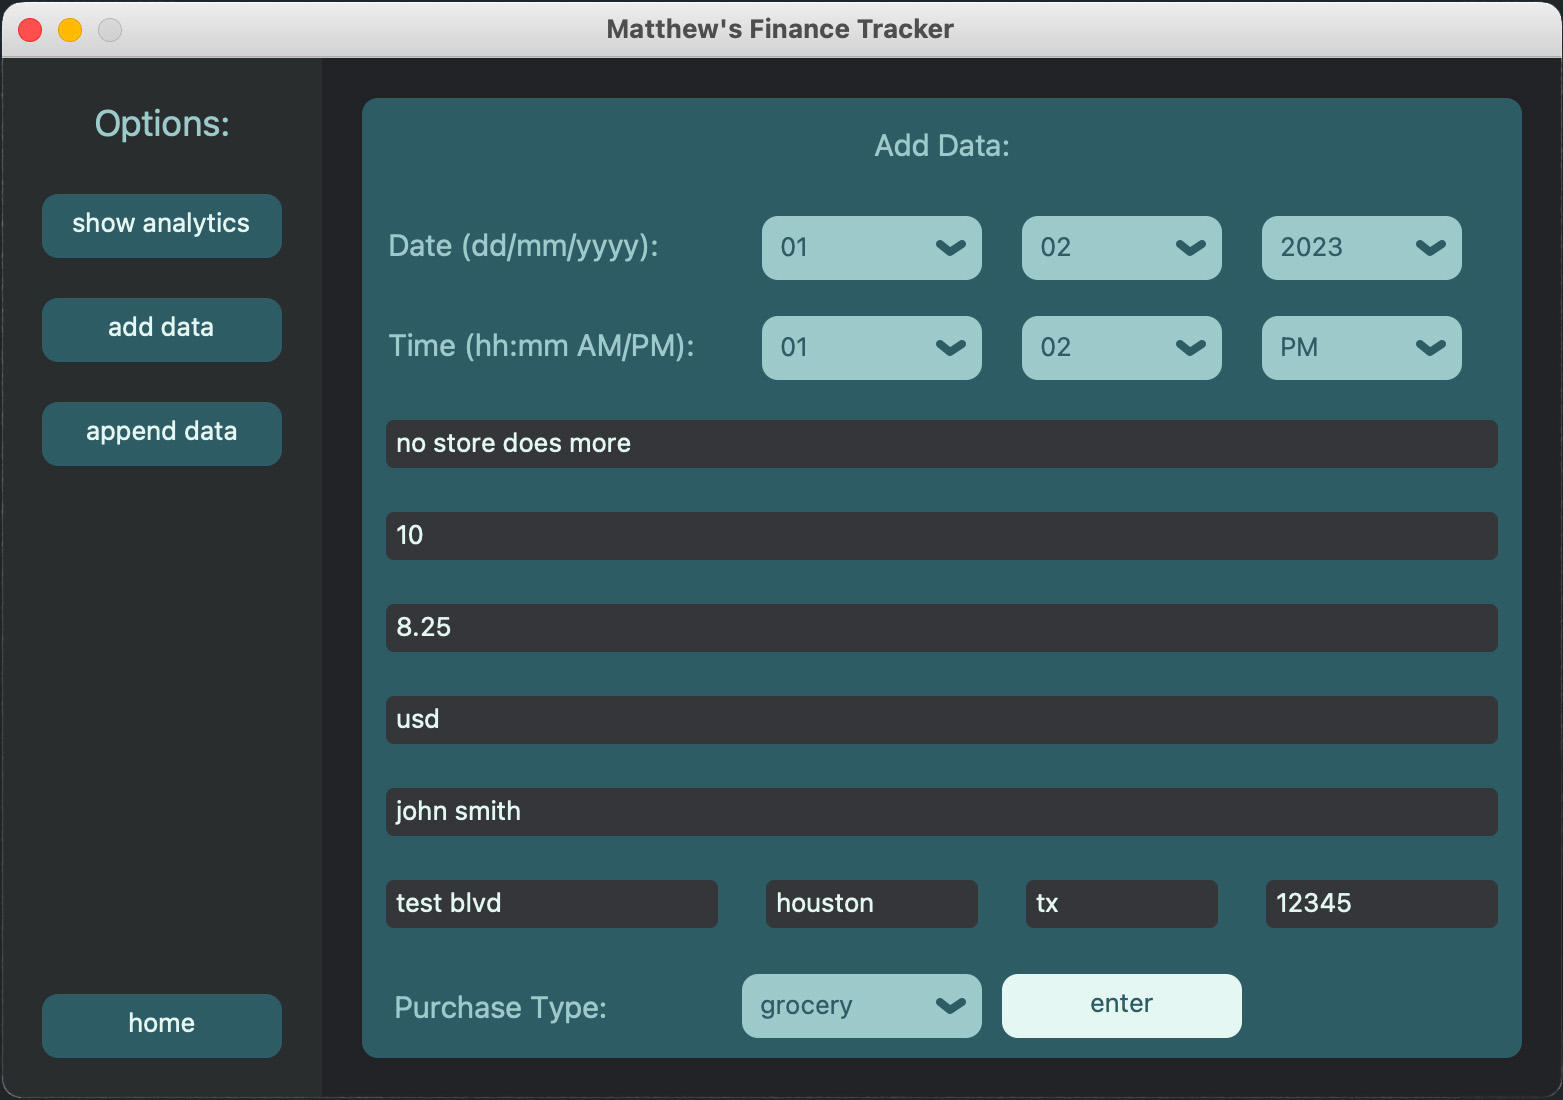
When entering data, some items are required to fill out, and others are optional. For example, fields such as the date are always mandatory, some fields are mandatory only if the user has a receipt, such as the purchase amount, and some fields are always optional, such as the employee name
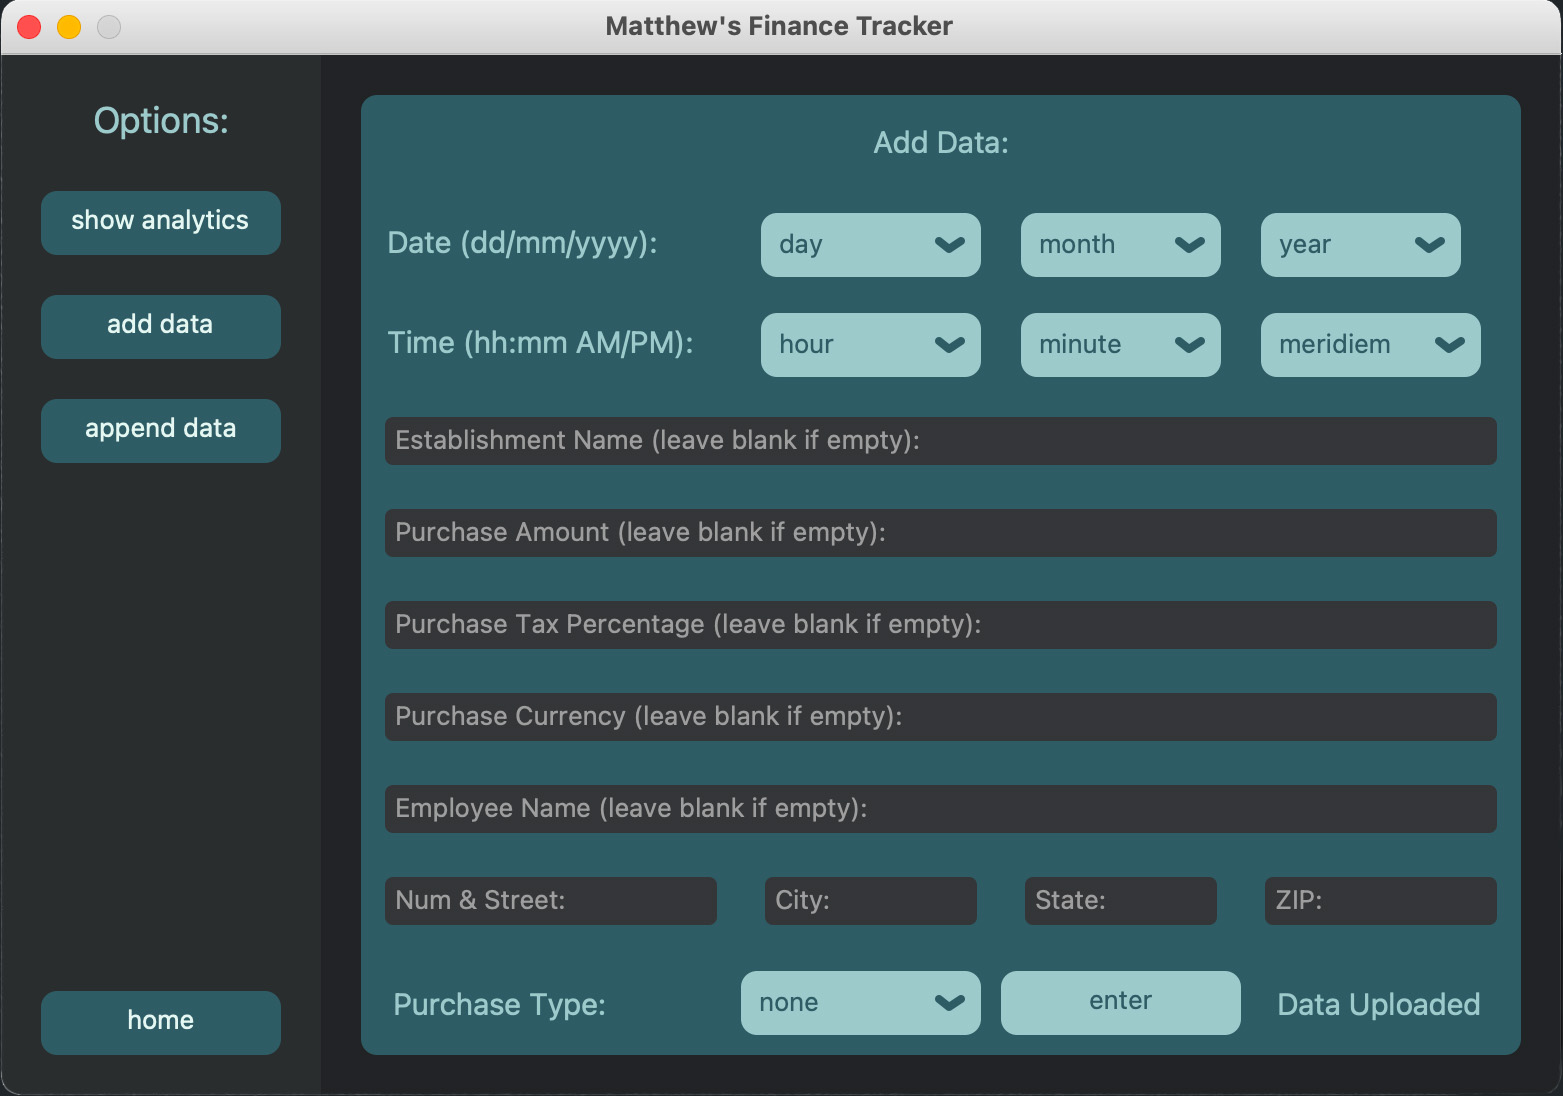
When the user finally enters the data, they are greeted with a confirmation message that the data has been successfully uploaded, and a blank interface to enter more data if they so choose
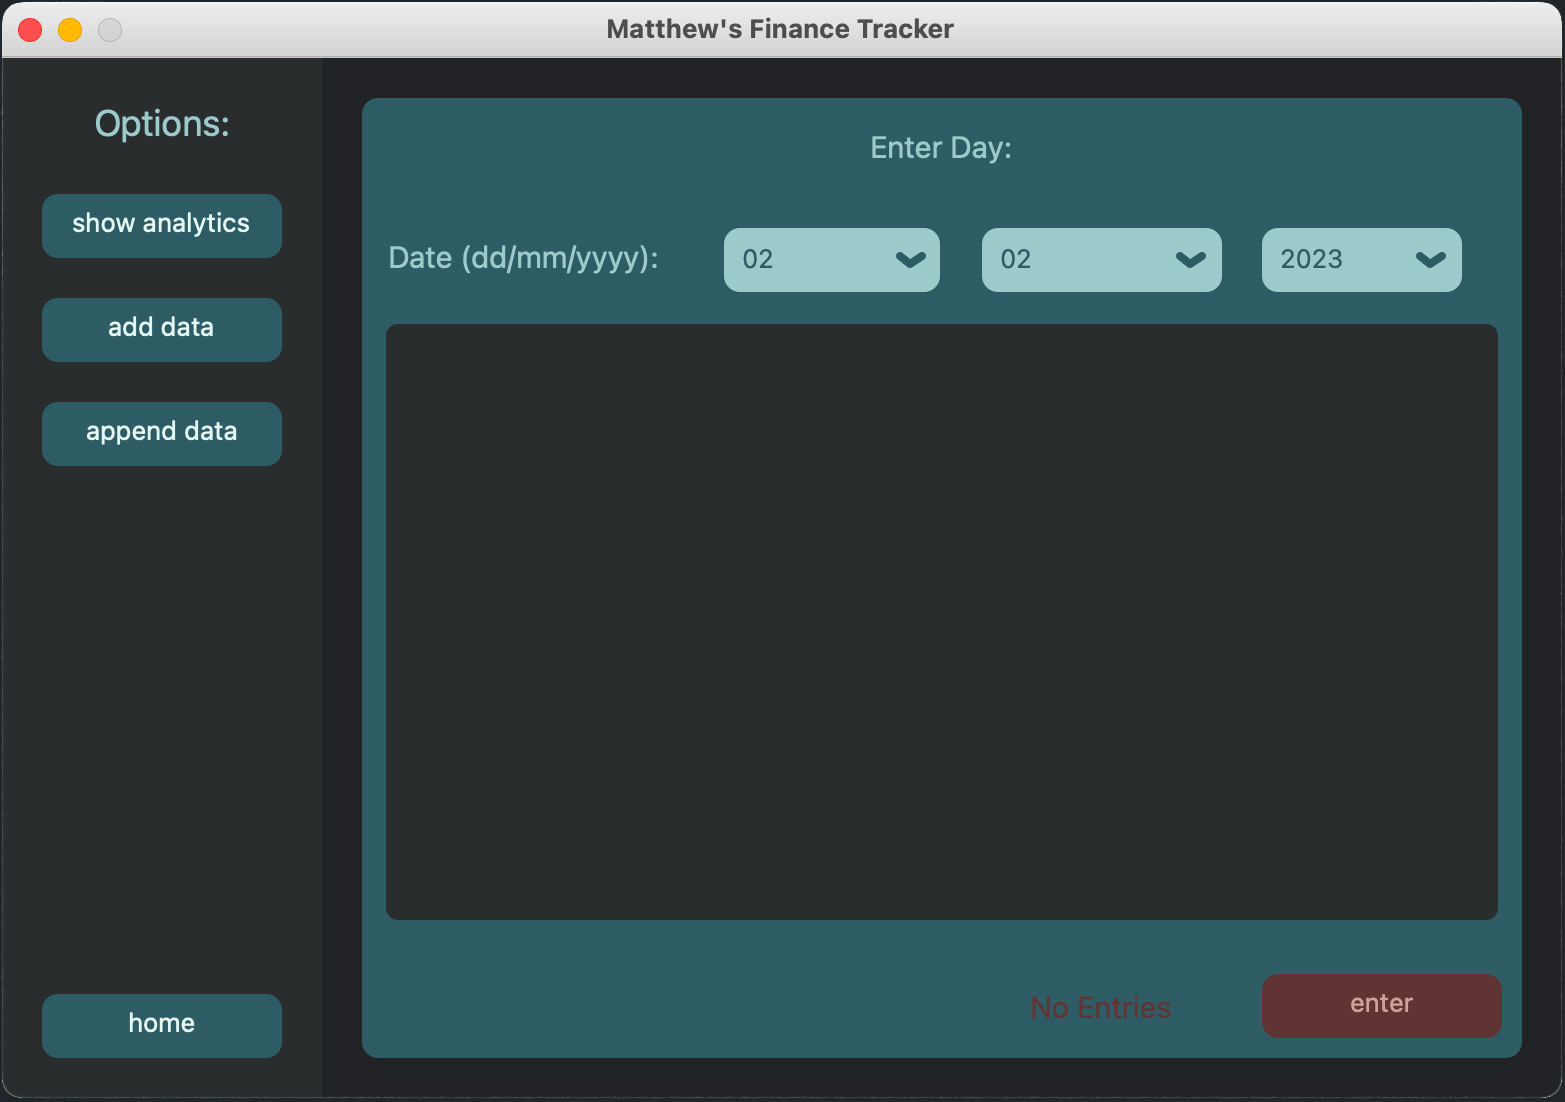
But what happens if no purchase was made? If the user has no receipt to enter, they can simply enter the desired date fields and press enter
But what happens if no purchase was made? If the user has no receipt to enter, they can simply enter the desired date fields and press enter
As seen by the 'Data Uploaded' success statement, the day was successfully recorded as having no purchases made, and the user is free to enter more data
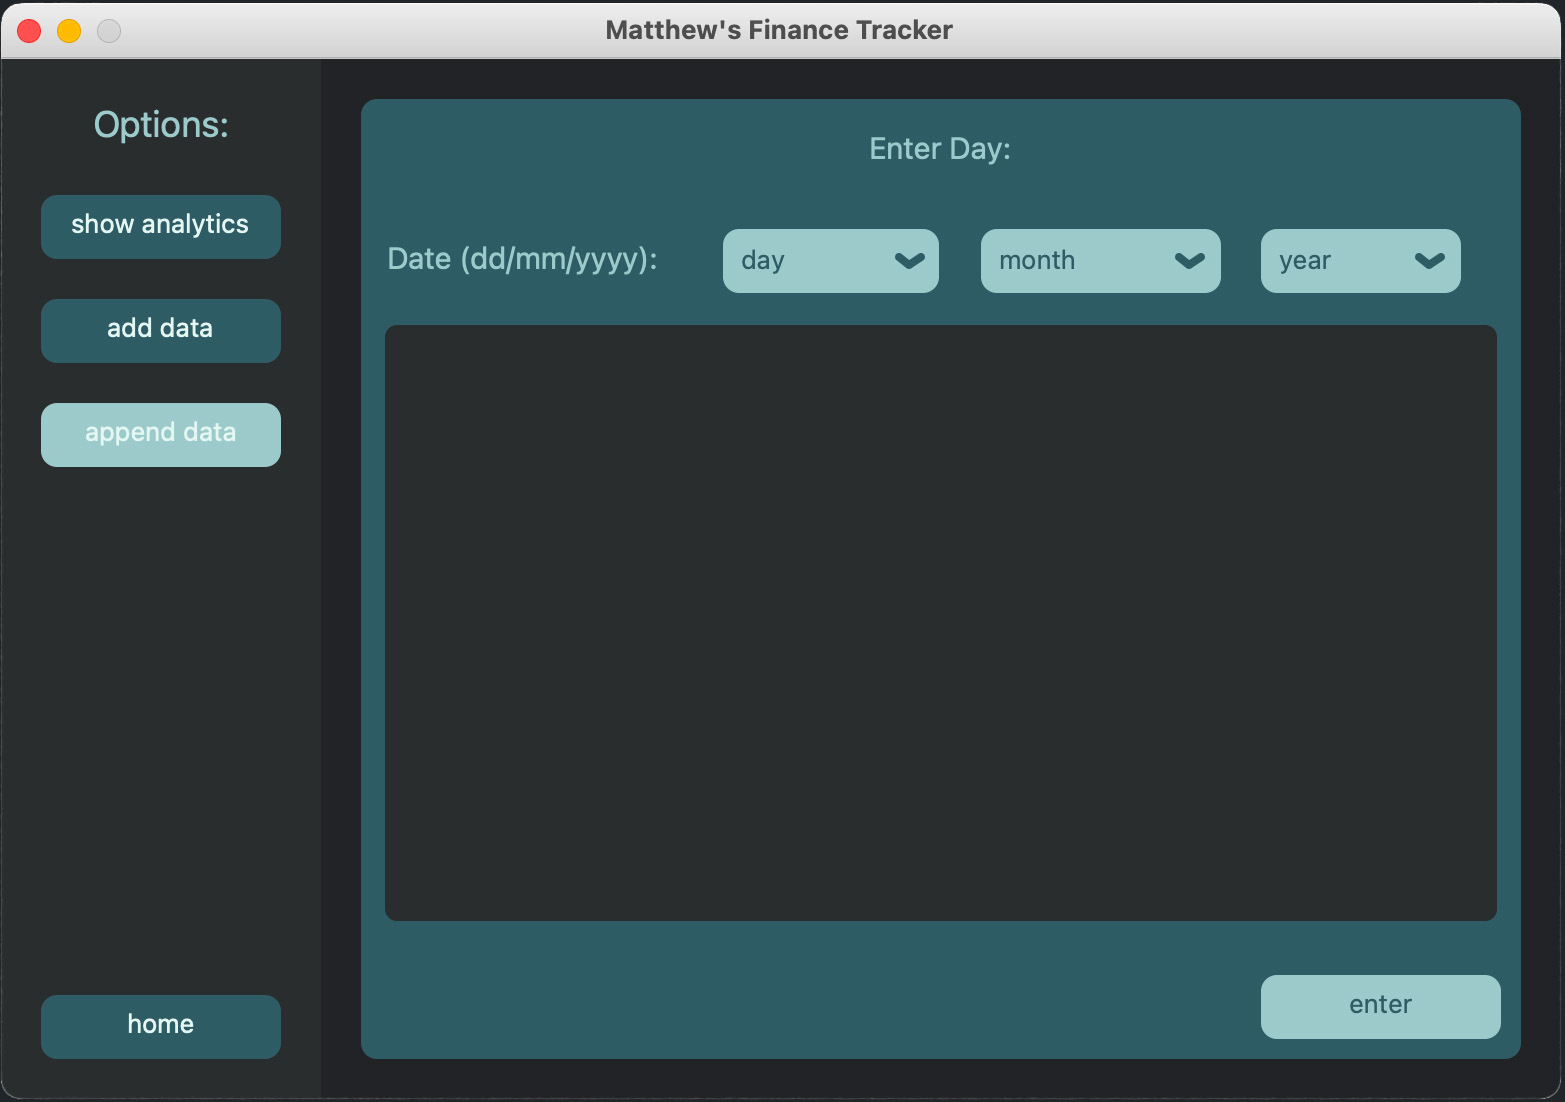
Nobody is perfect, and sometimes the user may make a mistake when entering data. If this is the case, they can simply press the 'append data' button to then go to the 'append data' menu
Nobody is perfect, and sometimes the user may make a mistake when entering data. If this is the case, they can simply press the 'append data' button to then go to the 'append data' menu
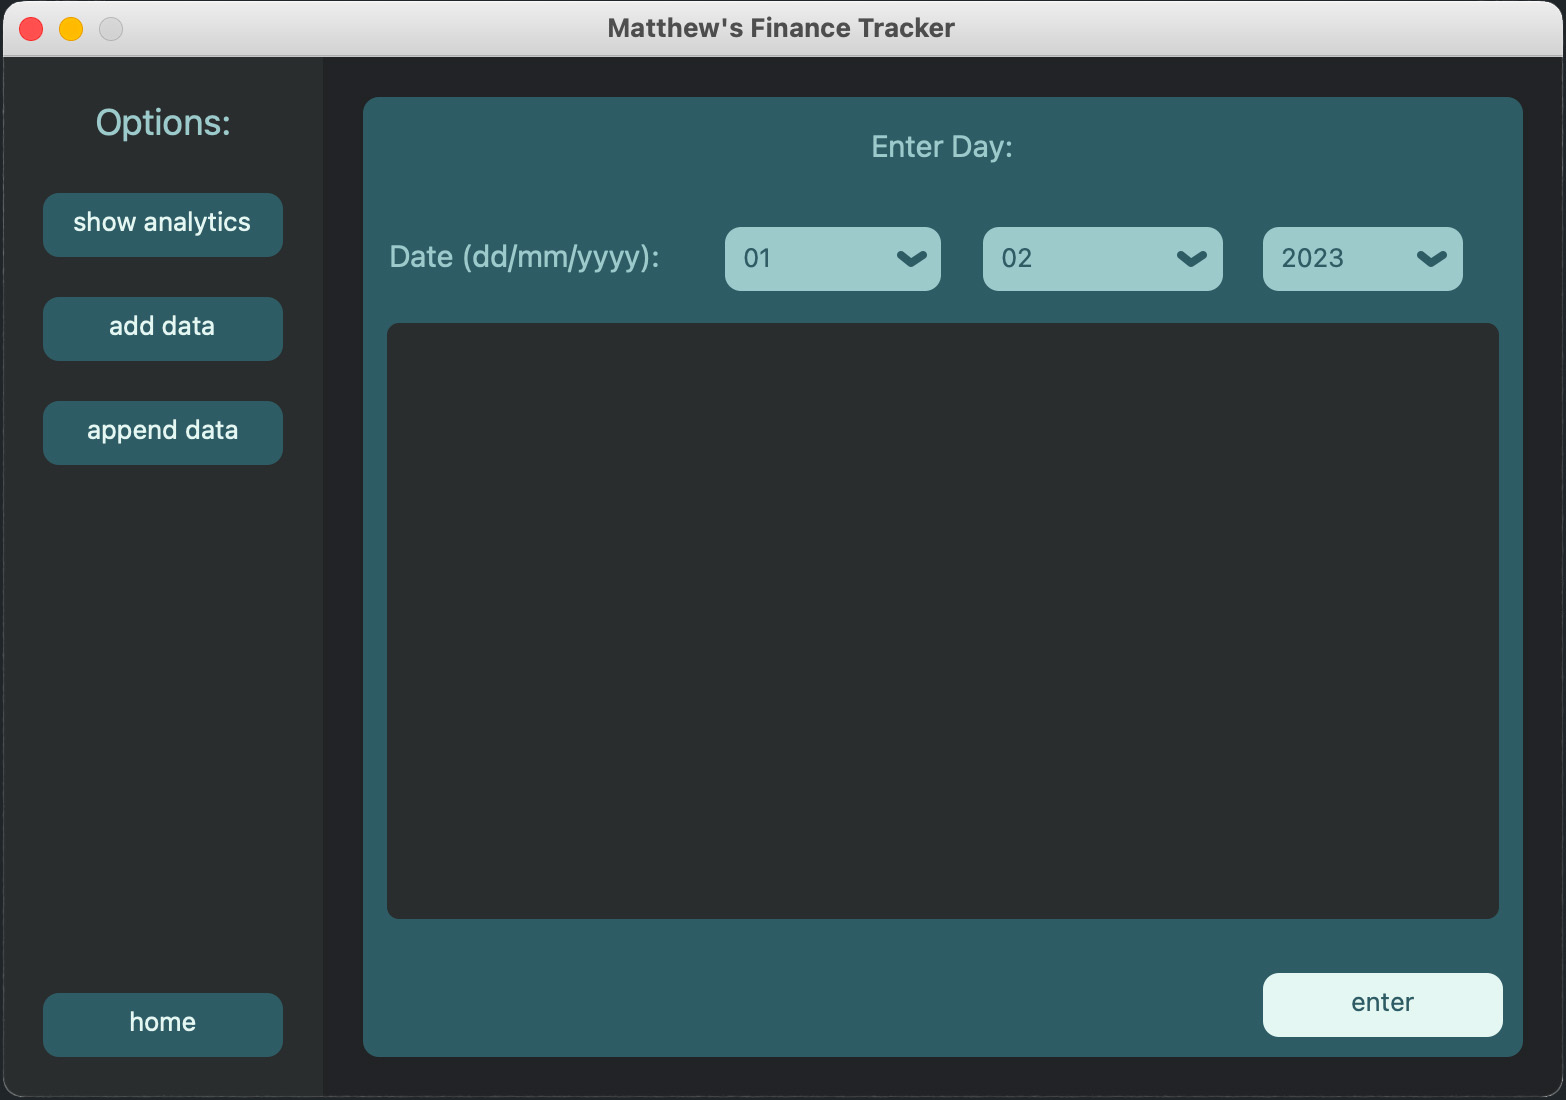
Here, the user can select the date of the entry they would like to append, and then press 'enter' to pop up a list of all entries made on that date
If there is an entry on the selected day, the user is greeted with an 'Entry(s) Found' success message, as well as a list of entries on the entered date
The user can then select the entry they would like to append, and then press the entry itself to begin changing data
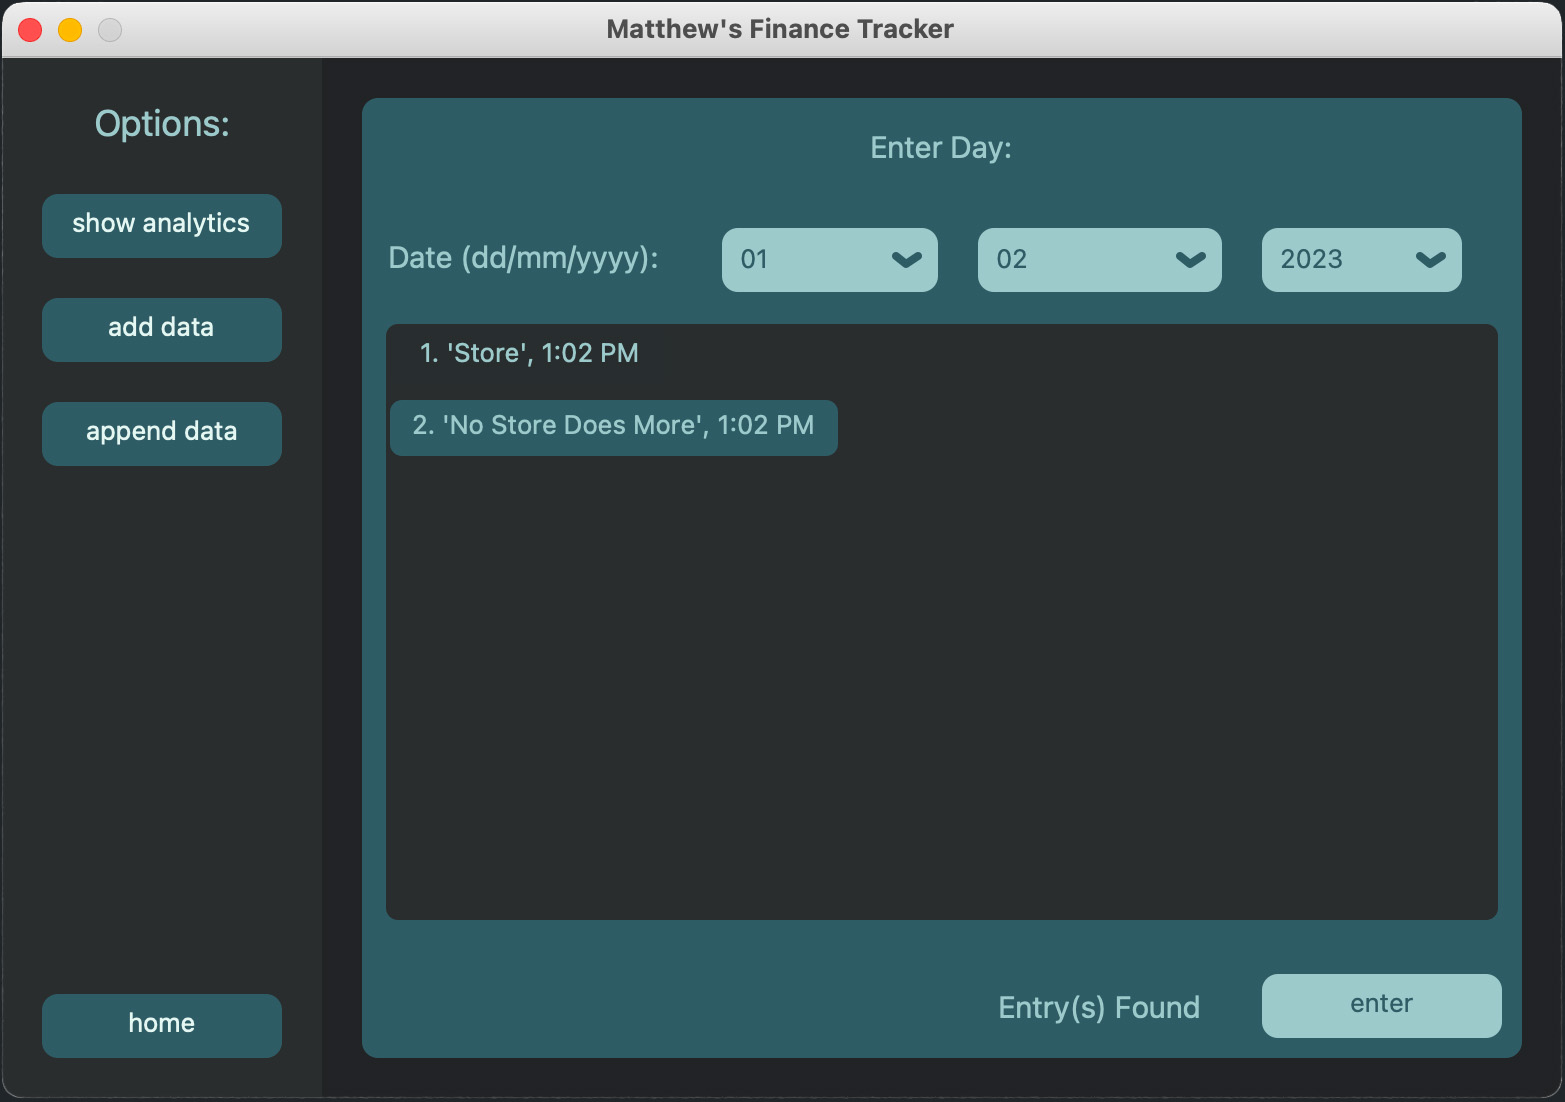
If there is an entry on the selected day, the user is greeted with an 'Entry(s) Found' success message, as well as a list of entries on the entered date
The user can then select the entry they would like to append, and then press the entry itself to begin changing data

The user can then change any data they would like, and then press 'enter' to confirm the changes, however in this case, the entry will instead be deleted altogether
Upon pressing the 'delete' button, a confirmation message will appear that asks the user 'Are You Sure?', to which the user can then press the once 'delete' button, now 'press again' button, to confirm the deletion
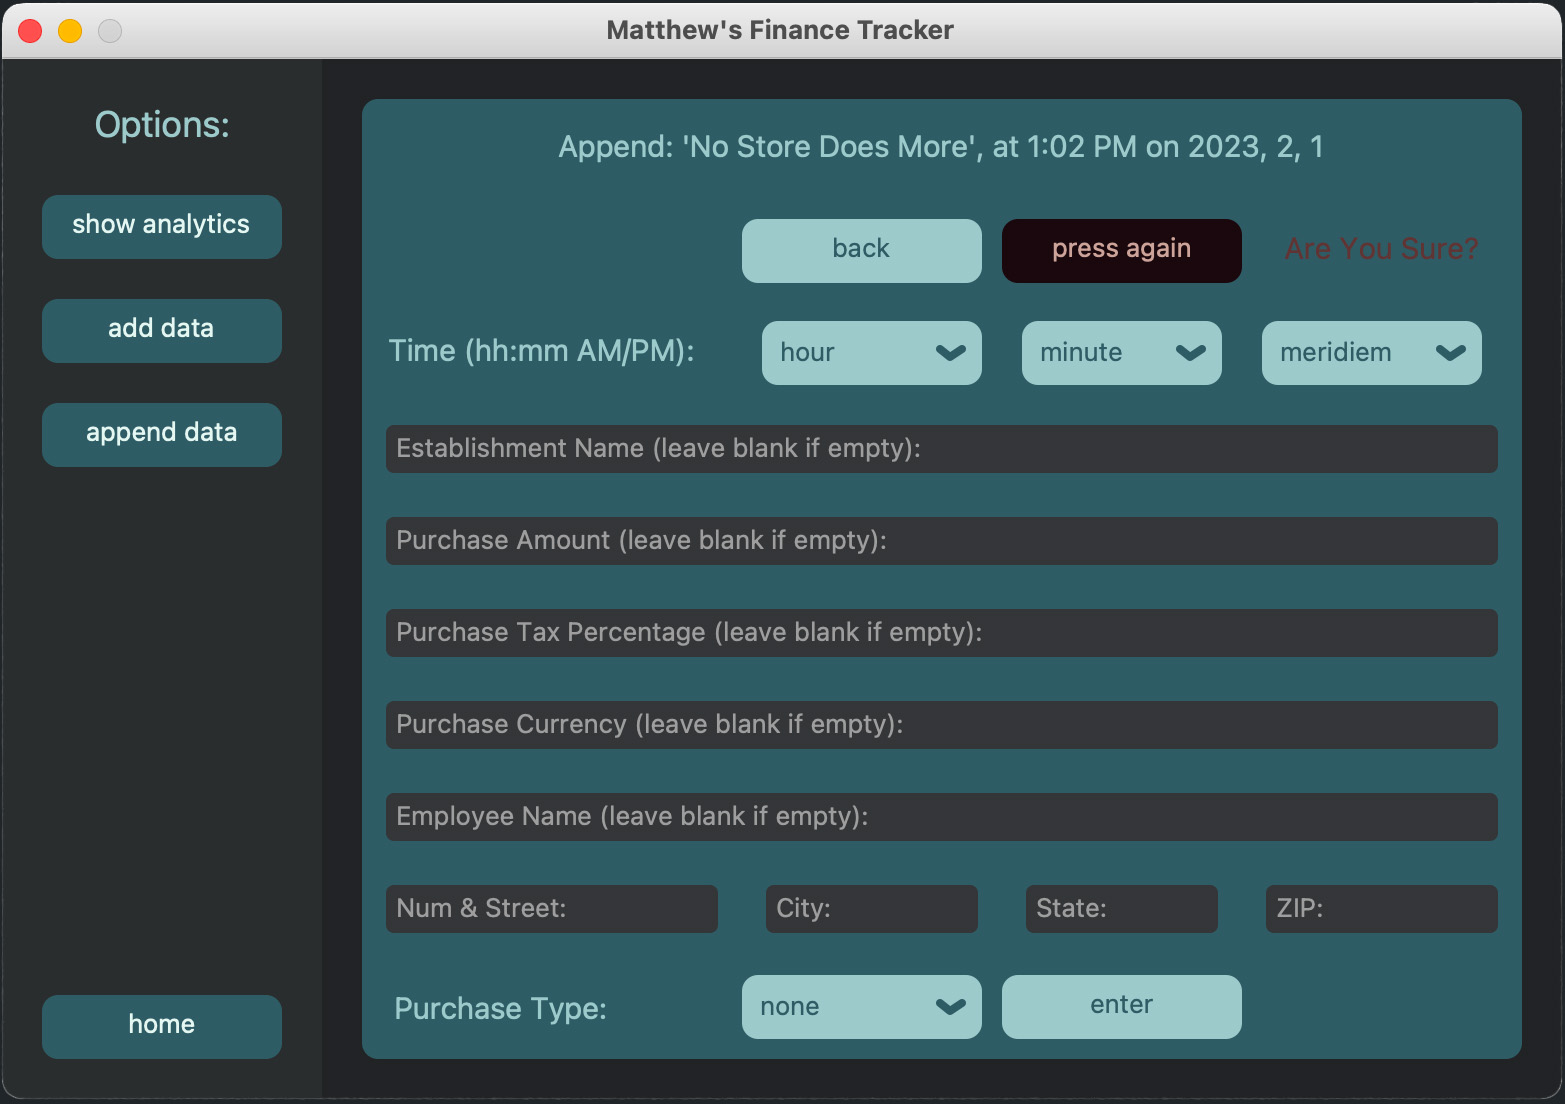
Upon pressing the 'delete' button, a confirmation message will appear that asks the user 'Are You Sure?', to which the user can then press the once 'delete' button, now 'press again' button, to confirm the deletion
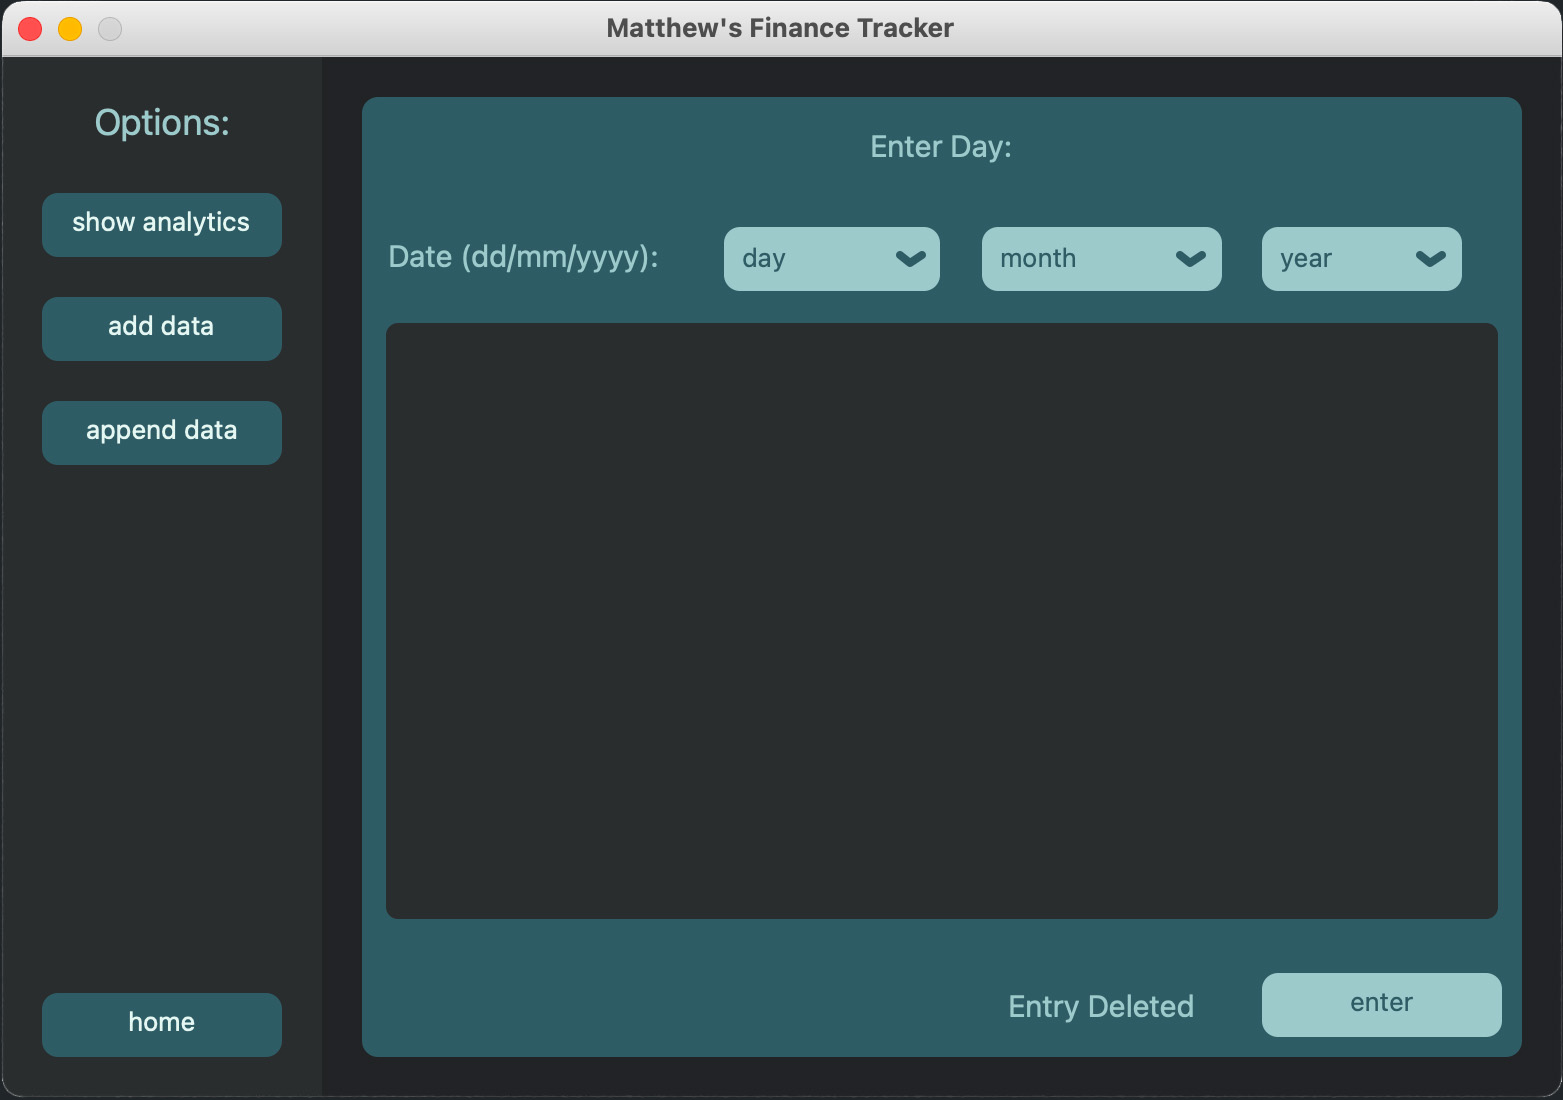
Having successfully deleted the entry, the user is greeted with an 'Entry Deleted' success message, and is free to append more data
After entering all of their data, the user can then press the 'analyze data' button to go begin looking at their earning and spending (in my case, spending, I was in college) habits
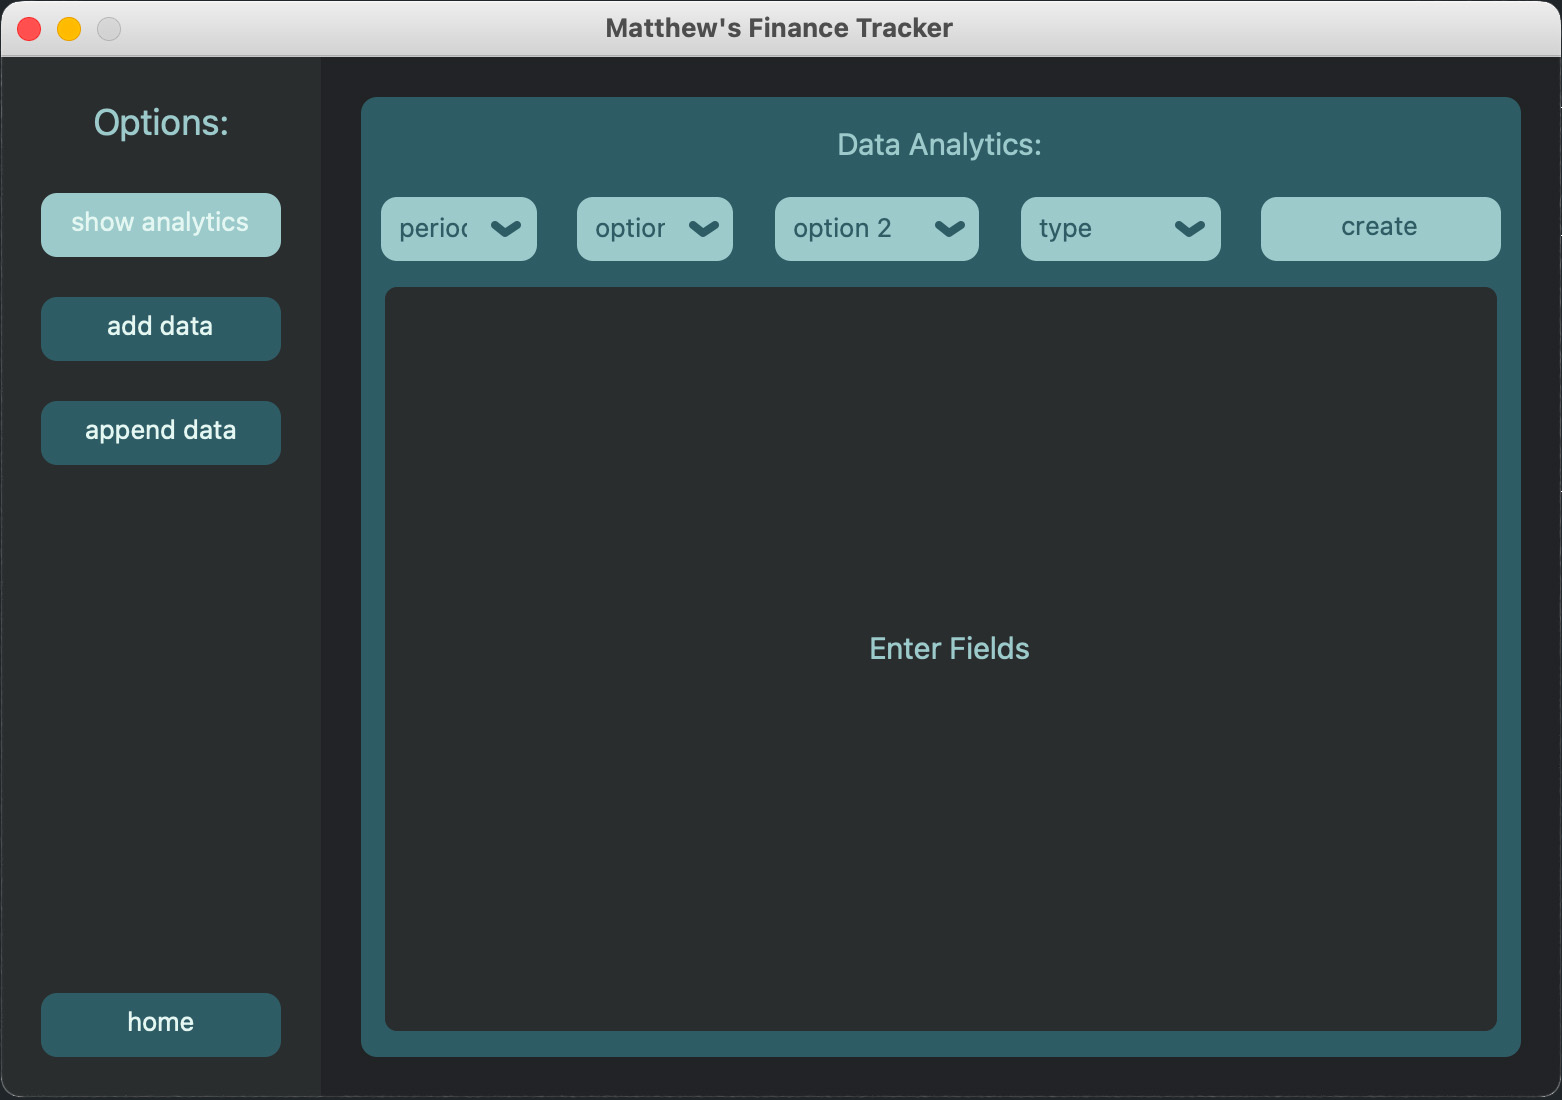
After entering all of their data, the user can then press the 'analyze data' button to go begin looking at their earning and spending (in my case, spending, I was in college) habits
On this page, the user can see a plethora of useful metrics on a month, quarter, year, or total basis, such as (but not limited to):
How often they visited a location, city, or state; a line of best fit representing their earning or spending in a particular category; and a rolling average chart that displays the movement of their money in an easy-to-digest manner, as well as a trend line that provides a more accurate representation of the data; and finally, a way to compare different metrics (more on that later)
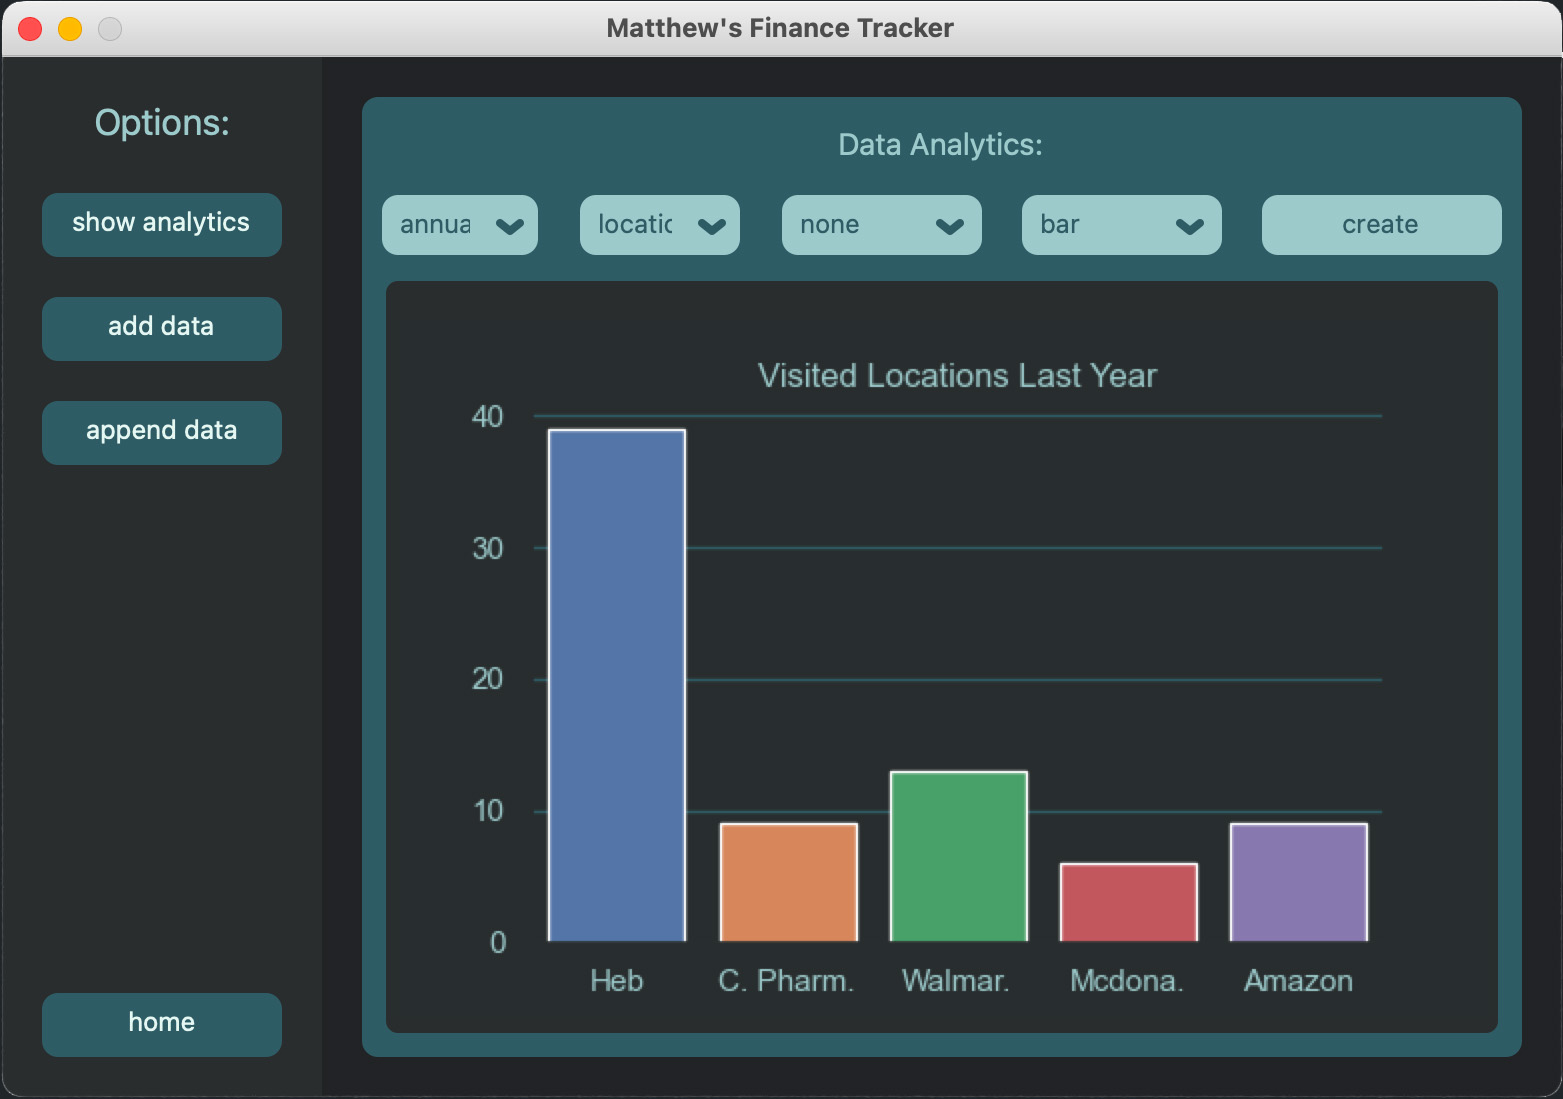
In this example, the user will be looking at the 'location' category in order to see how many times they visited a particular location in the past year in the form of a bar graph
As seen in the bar graph, the user visited the location 'Heb' the most, with the 4 runner-ups also being displayed
Fun fact: as of writing, I have been to Walmart 122 times, having used to live next to one (the nearest HEB was a 20-minute drive away)
As seen in the bar graph, the user visited the location 'Heb' the most, with the 4 runner-ups also being displayed
Fun fact: as of writing, I have been to Walmart 122 times, having used to live next to one (the nearest HEB was a 20-minute drive away)

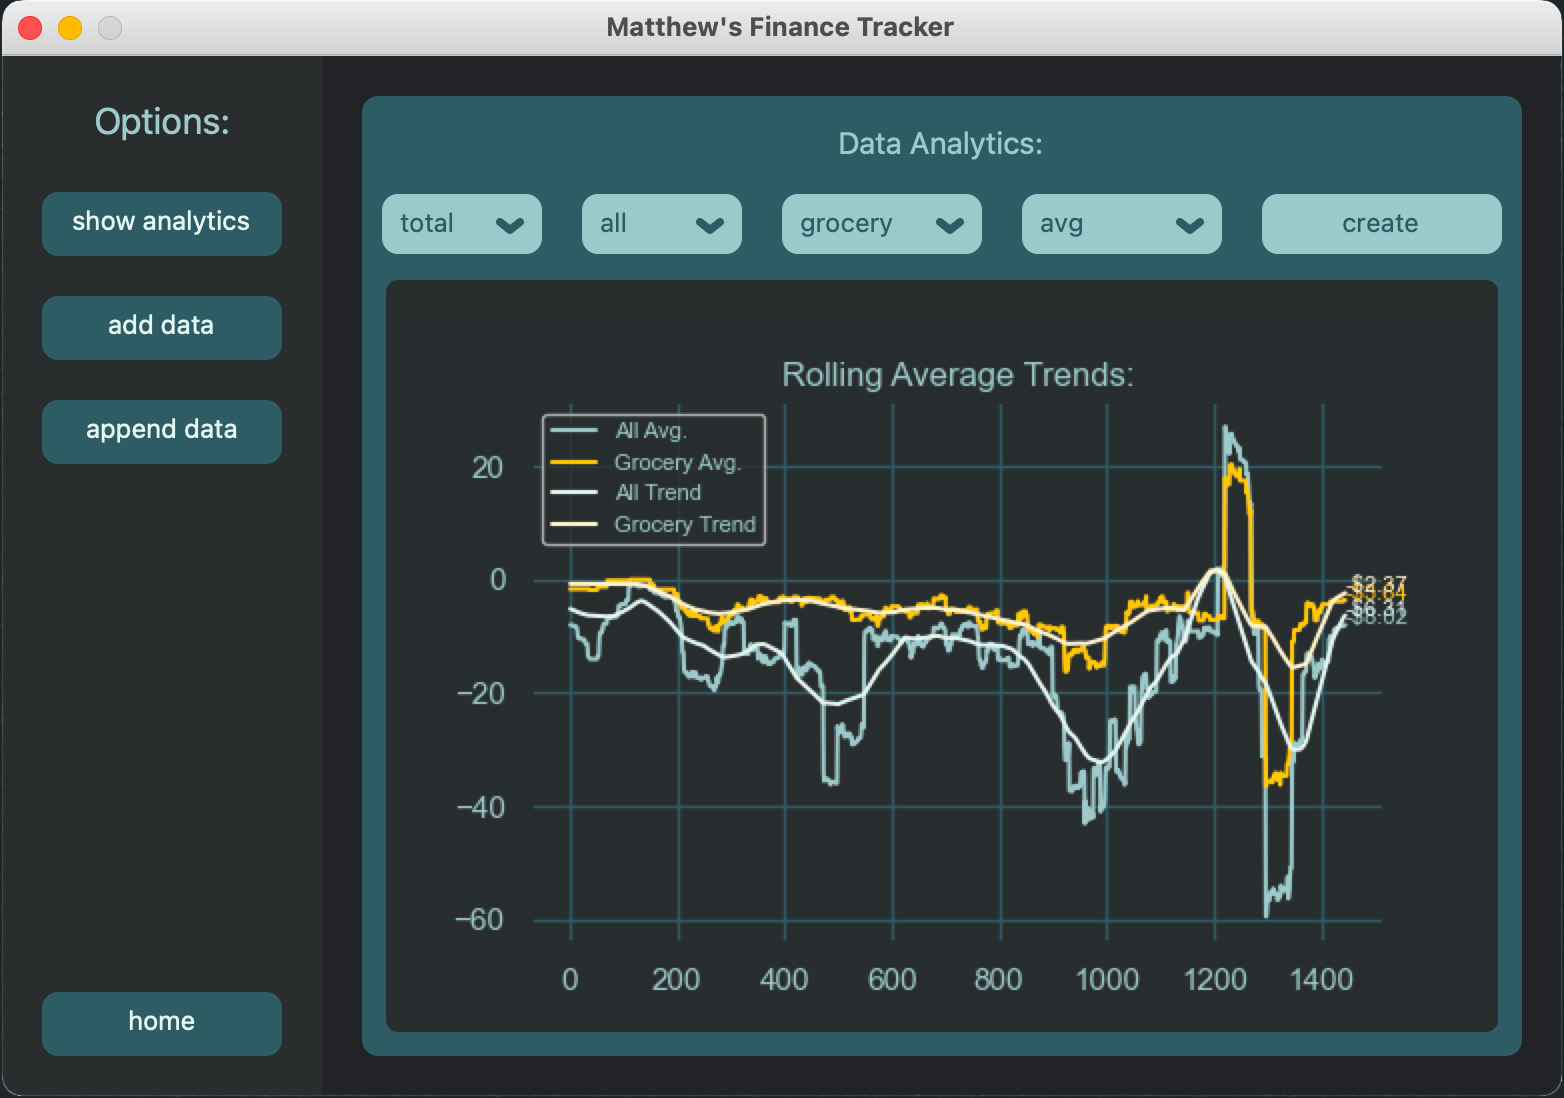
Should the user want to compare different metrics, doing so is as straight-forward as selecting a category in is the 'option 2' dropdown menu, and then pressing the 'create' button
In this example, the user will be comparing the 'all' category with the 'grocery' category in order to see how their grocery spending compares to how much they've spent in total
As seen in the rolling average chart, the movement of total spending is highly correlated with the movement of grocery spending, suggesting that groceries represent the bulwark of the user's spending
The utility of the trend line is also seen at work, providing a more accurate representation of the data, as some periods were certainly more expensive than others
The COVID-19 pandemic, rising gas prices, but surprisingly more than anything else (for me, at least), the holiday season and other real-world events often leave an impact on an individual's finances
But what happens if the user makes a mistake when entering data, like leaving out a mandatory field? Or they encounter a problem searching for an entry to append? Or they try to analyze data that either cant be quantified beyond total population, or is incompatible to be compared? Error statements will appear
In this case, the user has forgotten to enter the name of the location they made a purchase at, and is notified that they have missed a mandatory field
In this case, the user has entered a date that has no entries, and is notified that no entries were found
In this case, the user has entered a date that has no entries, and is notified that no entries were found
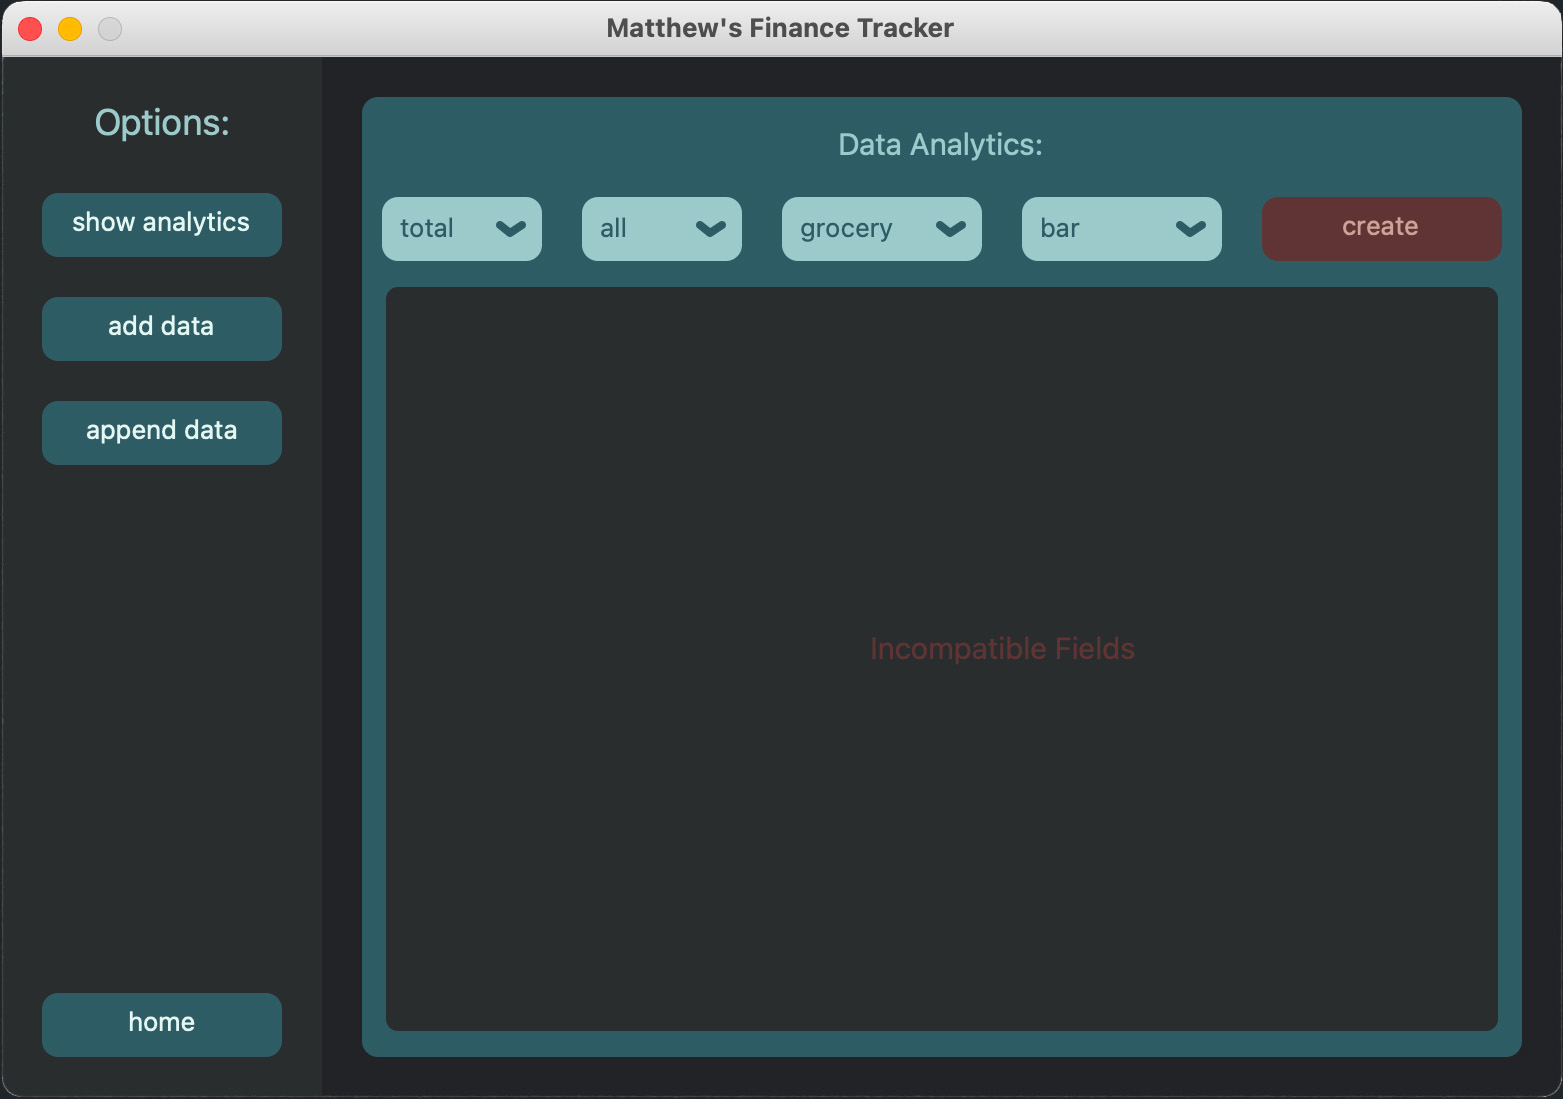
Finally, in this case, the user has tried to compare data that cant be represented as a bar graph, and is only logically available as a rolling average chart or as linear regression
This receipt analyzer represents the first brick laid in my programmatic foundation, as because it was my first real project, it marks the first time I had to think about how to structure a program, how to make it user-friendly, and how to make it look good
But on a more personal note, it was also what made me realize that if I really wanted to stand out, not just as a student, or as a professional, but as a human being, I would have to do more than what I was currently doing, and I would have to start questioning the ideas that I had held based on the results they had given me
The strategies I learned when trying to juggle everything in life while working on this little project are tools I still use as of writing, and without this project that I started when I was barely 21, who knows how long it would have taken me to eventually learn them
This software needs improvement; Python GUI's leave much to be desired, the code should not only be a handful of files, my regex functions could probably be better, and my database was accidentally OPEN TO THE NETWORK (I closed the ports after an absolute hero family friend n-mapped and found them, and I'm so thankful nobody in my building decided to punish me)
But I'm not deleting a single line of code; 'Receipt_Analyzer_3.0' taught me that if I need to do this again, I'm perfectly capable of writing some more
printf("-Matthew Thomas Beck");